Election présidentielle 2017
France Entière
Résultats incomplets calculés sur la base de 99.99% des inscrits reçus
Résultats au 2d tour
| Liste des candidats | Voix | % Inscrits | % Exprimés |
|---|---|---|---|
| M. Emmanuel MACRON | 20 703 694 | 43,63 | 66,06 |
| Mme Marine LE PEN | 10 637 120 | 22,42 | 33,94 |
Département de l'Ain
Résultats du département au 2d tour
| Liste des candidats | Voix | % Inscrits | % Exprimés |
|---|---|---|---|
| M. Emmanuel MACRON | 173 832 | 41,79 | 60,94 |
| Mme Marine LE PEN | 111 396 | 26,78 | 39,06 |
Commune de L'Abergement-Clémenciat
Résultats de la commune au 2d tour
| Liste des candidats | Voix | % Inscrits | % Exprimés |
|---|---|---|---|
| M. Emmanuel MACRON | 272 | 45,48 | 60,04 |
| Mme Marine LE PEN | 181 | 30,27 | 39,96 |
Commune de Baneins
Résultats de la commune au 2d tour
| Liste des candidats | Voix | % Inscrits | % Exprimés |
|---|---|---|---|
| Mme Marine LE PEN | 161 | 35,94 | 50,47 |
| M. Emmanuel MACRON | 158 | 35,27 | 49,53 |
Commune de Bouligneux
Résultats de la commune au 2d tour
| Liste des candidats | Voix | % Inscrits | % Exprimés |
|---|---|---|---|
| M. Emmanuel MACRON | 101 | 37,97 | 54,30 |
| Mme Marine LE PEN | 85 | 31,95 | 45,70 |
Commune de Chaneins
Résultats de la commune au 2d tour
| Liste des candidats | Voix | % Inscrits | % Exprimés |
|---|---|---|---|
| Mme Marine LE PEN | 270 | 40,18 | 54,55 |
| M. Emmanuel MACRON | 225 | 33,48 | 45,45 |
Commune de Châtenay
Résultats de la commune au 2d tour
| Liste des candidats | Voix | % Inscrits | % Exprimés |
|---|---|---|---|
| M. Emmanuel MACRON | 91 | 35,97 | 50,56 |
| Mme Marine LE PEN | 89 | 35,18 | 49,44 |
Commune de Châtillon-sur-Chalaronne
Résultats de la commune au 2d tour
| Liste des candidats | Voix | % Inscrits | % Exprimés |
|---|---|---|---|
| M. Emmanuel MACRON | 1 356 | 38,70 | 58,37 |
| Mme Marine LE PEN | 967 | 27,60 | 41,63 |
Commune de Crans
Résultats de la commune au 2d tour
| Liste des candidats | Voix | % Inscrits | % Exprimés |
|---|---|---|---|
| Mme Marine LE PEN | 82 | 40,59 | 54,30 |
| M. Emmanuel MACRON | 69 | 34,16 | 45,70 |
Commune de Lapeyrouse
Résultats de la commune au 2d tour
| Liste des candidats | Voix | % Inscrits | % Exprimés |
|---|---|---|---|
| Mme Marine LE PEN | 105 | 42,34 | 59,32 |
| M. Emmanuel MACRON | 72 | 29,03 | 40,68 |
Commune de Marlieux
Résultats de la commune au 2d tour
| Liste des candidats | Voix | % Inscrits | % Exprimés |
|---|---|---|---|
| Mme Marine LE PEN | 246 | 36,61 | 50,62 |
| M. Emmanuel MACRON | 240 | 35,71 | 49,38 |
Commune de Monthieux
Résultats de la commune au 2d tour
| Liste des candidats | Voix | % Inscrits | % Exprimés |
|---|---|---|---|
| M. Emmanuel MACRON | 216 | 43,55 | 59,18 |
| Mme Marine LE PEN | 149 | 30,04 | 40,82 |
Commune de Relevant
Résultats de la commune au 2d tour
| Liste des candidats | Voix | % Inscrits | % Exprimés |
|---|---|---|---|
| M. Emmanuel MACRON | 134 | 39,41 | 50,76 |
| Mme Marine LE PEN | 130 | 38,24 | 49,24 |
Commune de Saint-André-de-Corcy
Résultats de la commune au 2d tour
| Liste des candidats | Voix | % Inscrits | % Exprimés |
|---|---|---|---|
| M. Emmanuel MACRON | 951 | 37,80 | 55,52 |
| Mme Marine LE PEN | 762 | 30,29 | 44,48 |
Commune de Saint-Georges-sur-Renon
Résultats de la commune au 2d tour
| Liste des candidats | Voix | % Inscrits | % Exprimés |
|---|---|---|---|
| Mme Marine LE PEN | 53 | 35,57 | 52,48 |
| M. Emmanuel MACRON | 48 | 32,21 | 47,52 |
Commune de Saint-Marcel
Résultats de la commune au 2d tour
| Liste des candidats | Voix | % Inscrits | % Exprimés |
|---|---|---|---|
| Mme Marine LE PEN | 320 | 35,67 | 50,08 |
| M. Emmanuel MACRON | 319 | 35,56 | 49,92 |
Commune de Sainte-Olive
Résultats de la commune au 2d tour
| Liste des candidats | Voix | % Inscrits | % Exprimés |
|---|---|---|---|
| M. Emmanuel MACRON | 85 | 37,95 | 53,80 |
| Mme Marine LE PEN | 73 | 32,59 | 46,20 |
Commune de Saint-Trivier-sur-Moignans
Résultats de la commune au 2d tour
| Liste des candidats | Voix | % Inscrits | % Exprimés |
|---|---|---|---|
| Mme Marine LE PEN | 495 | 37,00 | 53,11 |
| M. Emmanuel MACRON | 437 | 32,66 | 46,89 |
Commune de Sulignat
Résultats de la commune au 2d tour
| Liste des candidats | Voix | % Inscrits | % Exprimés |
|---|---|---|---|
| M. Emmanuel MACRON | 171 | 40,33 | 53,94 |
| Mme Marine LE PEN | 146 | 34,43 | 46,06 |
Commune de Villars-les-Dombes
Résultats de la commune au 2d tour
| Liste des candidats | Voix | % Inscrits | % Exprimés |
|---|---|---|---|
| M. Emmanuel MACRON | 1 322 | 40,87 | 58,34 |
| Mme Marine LE PEN | 944 | 29,18 | 41,66 |
Commune de Ambérieux-en-Dombes
Résultats de la commune au 2d tour
| Liste des candidats | Voix | % Inscrits | % Exprimés |
|---|---|---|---|
| M. Emmanuel MACRON | 423 | 36,09 | 52,09 |
| Mme Marine LE PEN | 389 | 33,19 | 47,91 |
Commune de Birieux
Résultats de la commune au 2d tour
| Liste des candidats | Voix | % Inscrits | % Exprimés |
|---|---|---|---|
| Mme Marine LE PEN | 83 | 42,78 | 58,45 |
| M. Emmanuel MACRON | 59 | 30,41 | 41,55 |
Commune de Chalamont
Résultats de la commune au 2d tour
| Liste des candidats | Voix | % Inscrits | % Exprimés |
|---|---|---|---|
| M. Emmanuel MACRON | 540 | 35,00 | 50,61 |
| Mme Marine LE PEN | 527 | 34,15 | 49,39 |
Commune de La Chapelle-du-Châtelard
Résultats de la commune au 2d tour
| Liste des candidats | Voix | % Inscrits | % Exprimés |
|---|---|---|---|
| M. Emmanuel MACRON | 110 | 37,80 | 56,12 |
| Mme Marine LE PEN | 86 | 29,55 | 43,88 |
Commune de Châtillon-la-Palud
Résultats de la commune au 2d tour
| Liste des candidats | Voix | % Inscrits | % Exprimés |
|---|---|---|---|
| M. Emmanuel MACRON | 457 | 38,05 | 52,41 |
| Mme Marine LE PEN | 415 | 34,55 | 47,59 |
Commune de Condeissiat
Résultats de la commune au 2d tour
| Liste des candidats | Voix | % Inscrits | % Exprimés |
|---|---|---|---|
| M. Emmanuel MACRON | 244 | 41,71 | 57,96 |
| Mme Marine LE PEN | 177 | 30,26 | 42,04 |
Commune de Dompierre-sur-Chalaronne
Résultats de la commune au 2d tour
| Liste des candidats | Voix | % Inscrits | % Exprimés |
|---|---|---|---|
| M. Emmanuel MACRON | 124 | 43,66 | 60,78 |
| Mme Marine LE PEN | 80 | 28,17 | 39,22 |
Commune de Le Plantay
Résultats de la commune au 2d tour
| Liste des candidats | Voix | % Inscrits | % Exprimés |
|---|---|---|---|
| Mme Marine LE PEN | 147 | 37,60 | 52,69 |
| M. Emmanuel MACRON | 132 | 33,76 | 47,31 |
Commune de Mionnay
Résultats de la commune au 2d tour
| Liste des candidats | Voix | % Inscrits | % Exprimés |
|---|---|---|---|
| M. Emmanuel MACRON | 748 | 43,09 | 61,11 |
| Mme Marine LE PEN | 476 | 27,42 | 38,89 |
Commune de Neuville-les-Dames
Résultats de la commune au 2d tour
| Liste des candidats | Voix | % Inscrits | % Exprimés |
|---|---|---|---|
| M. Emmanuel MACRON | 373 | 36,18 | 51,59 |
| Mme Marine LE PEN | 350 | 33,95 | 48,41 |
Commune de Romans
Résultats de la commune au 2d tour
| Liste des candidats | Voix | % Inscrits | % Exprimés |
|---|---|---|---|
| M. Emmanuel MACRON | 136 | 35,98 | 50,18 |
| Mme Marine LE PEN | 135 | 35,71 | 49,82 |
Commune de Saint-André-le-Bouchoux
Résultats de la commune au 2d tour
| Liste des candidats | Voix | % Inscrits | % Exprimés |
|---|---|---|---|
| M. Emmanuel MACRON | 103 | 42,56 | 55,38 |
| Mme Marine LE PEN | 83 | 34,30 | 44,62 |
Commune de Saint-Germain-sur-Renon
Résultats de la commune au 2d tour
| Liste des candidats | Voix | % Inscrits | % Exprimés |
|---|---|---|---|
| Mme Marine LE PEN | 79 | 38,92 | 56,03 |
| M. Emmanuel MACRON | 62 | 30,54 | 43,97 |
Commune de Saint-Nizier-le-Désert
Résultats de la commune au 2d tour
| Liste des candidats | Voix | % Inscrits | % Exprimés |
|---|---|---|---|
| Mme Marine LE PEN | 261 | 42,16 | 57,87 |
| M. Emmanuel MACRON | 190 | 30,69 | 42,13 |
Commune de Saint-Paul-de-Varax
Résultats de la commune au 2d tour
| Liste des candidats | Voix | % Inscrits | % Exprimés |
|---|---|---|---|
| Mme Marine LE PEN | 381 | 36,29 | 52,84 |
| M. Emmanuel MACRON | 340 | 32,38 | 47,16 |
Commune de Sandrans
Résultats de la commune au 2d tour
| Liste des candidats | Voix | % Inscrits | % Exprimés |
|---|---|---|---|
| M. Emmanuel MACRON | 134 | 35,26 | 50,00 |
| Mme Marine LE PEN | 134 | 35,26 | 50,00 |
Commune de Valeins
Résultats de la commune au 2d tour
| Liste des candidats | Voix | % Inscrits | % Exprimés |
|---|---|---|---|
| M. Emmanuel MACRON | 30 | 32,61 | 51,72 |
| Mme Marine LE PEN | 28 | 30,43 | 48,28 |
Commune de Villette-sur-Ain
Résultats de la commune au 2d tour
| Liste des candidats | Voix | % Inscrits | % Exprimés |
|---|---|---|---|
| M. Emmanuel MACRON | 225 | 38,66 | 52,82 |
| Mme Marine LE PEN | 201 | 34,54 | 47,18 |
Taux de participation 2ème tour
Résultats du département au 1er tour
| Liste des candidats | Voix | % Inscrits | % Exprimés |
|---|---|---|---|
| Mme Marine LE PEN | 81 455 | 19,58 | 25,00 |
| M. Emmanuel MACRON | 73 692 | 17,72 | 22,62 |
| M. François FILLON | 69 804 | 16,78 | 21,43 |
| M. Jean-Luc MÉLENCHON | 51 736 | 12,44 | 15,88 |
| M. Nicolas DUPONT-AIGNAN | 19 788 | 4,76 | 6,07 |
| M. Benoît HAMON | 16 711 | 4,02 | 5,13 |
| M. François ASSELINEAU | 3 612 | 0,87 | 1,11 |
| M. Jean LASSALLE | 3 465 | 0,83 | 1,06 |
| M. Philippe POUTOU | 3 098 | 0,74 | 0,95 |
| Mme Nathalie ARTHAUD | 1 842 | 0,44 | 0,57 |
| M. Jacques CHEMINADE | 595 | 0,14 | 0,18 |
Résultats estimatifs par communes de la Dombes
Commune de L'Abergement-Clémenciat
résultats de la commune au 1er tour
| Liste des candidats | Voix | % Inscrits | % Exprimés |
|---|---|---|---|
| Mme Marine LE PEN | 126 | 21,07 | 25,45 |
| M. Emmanuel MACRON | 119 | 19,90 | 24,04 |
| M. François FILLON | 110 | 18,39 | 22,22 |
| M. Jean-Luc MÉLENCHON | 59 | 9,87 | 11,92 |
| M. Nicolas DUPONT-AIGNAN | 34 | 5,69 | 6,87 |
| M. Benoît HAMON | 29 | 4,85 | 5,86 |
| M. François ASSELINEAU | 6 | 1,00 | 1,21 |
| Mme Nathalie ARTHAUD | 4 | 0,67 | 0,81 |
| M. Philippe POUTOU | 4 | 0,67 | 0,81 |
| M. Jacques CHEMINADE | 2 | 0,33 | 0,40 |
| M. Jean LASSALLE | 2 | 0,33 | 0,40 |
Commune de Baneins
résultats de la commune au 1er tour
| Liste des candidats | Voix | % Inscrits | % Exprimés |
|---|---|---|---|
| Mme Marine LE PEN | 139 | 31,03 | 39,04 |
| M. Emmanuel MACRON | 73 | 16,29 | 20,51 |
| M. François FILLON | 63 | 14,06 | 17,70 |
| M. Jean-Luc MÉLENCHON | 40 | 8,93 | 11,24 |
| M. Nicolas DUPONT-AIGNAN | 17 | 3,79 | 4,78 |
| M. Benoît HAMON | 13 | 2,90 | 3,65 |
| M. Jean LASSALLE | 6 | 1,34 | 1,69 |
| M. Jacques CHEMINADE | 3 | 0,67 | 0,84 |
| M. Philippe POUTOU | 2 | 0,45 | 0,56 |
| Mme Nathalie ARTHAUD | 0 | 0,00 | 0,00 |
| M. François ASSELINEAU | 0 | 0,00 | 0,00 |
Commune de Bouligneux
résultats de la commune au 1er tour
| Liste des candidats | Voix | % Inscrits | % Exprimés |
|---|---|---|---|
| M. François FILLON | 73 | 27,44 | 32,44 |
| Mme Marine LE PEN | 51 | 19,17 | 22,67 |
| M. Emmanuel MACRON | 39 | 14,66 | 17,33 |
| M. Jean-Luc MÉLENCHON | 26 | 9,77 | 11,56 |
| M. Nicolas DUPONT-AIGNAN | 17 | 6,39 | 7,56 |
| M. Benoît HAMON | 10 | 3,76 | 4,44 |
| M. Jean LASSALLE | 4 | 1,50 | 1,78 |
| M. François ASSELINEAU | 3 | 1,13 | 1,33 |
| Mme Nathalie ARTHAUD | 1 | 0,38 | 0,44 |
| M. Philippe POUTOU | 1 | 0,38 | 0,44 |
| M. Jacques CHEMINADE | 0 | 0,00 | 0,00 |
Commune de Chaneins
résultats de la commune au 1er tour
| Liste des candidats | Voix | % Inscrits | % Exprimés |
|---|---|---|---|
| Mme Marine LE PEN | 212 | 31,55 | 38,48 |
| M. François FILLON | 128 | 19,05 | 23,23 |
| M. Emmanuel MACRON | 84 | 12,50 | 15,25 |
| M. Jean-Luc MÉLENCHON | 65 | 9,67 | 11,80 |
| M. Nicolas DUPONT-AIGNAN | 27 | 4,02 | 4,90 |
| M. Benoît HAMON | 24 | 3,57 | 4,36 |
| M. Jean LASSALLE | 6 | 0,89 | 1,09 |
| Mme Nathalie ARTHAUD | 3 | 0,45 | 0,54 |
| M. Philippe POUTOU | 1 | 0,15 | 0,18 |
| M. François ASSELINEAU | 1 | 0,15 | 0,18 |
| M. Jacques CHEMINADE | 0 | 0,00 | 0,00 |
Commune de Châtenay
résultats de la commune au 1er tour
| Liste des candidats | Voix | % Inscrits | % Exprimés |
|---|---|---|---|
| M. François FILLON | 58 | 22,92 | 27,10 |
| Mme Marine LE PEN | 54 | 21,34 | 25,23 |
| M. Emmanuel MACRON | 37 | 14,62 | 17,29 |
| M. Jean-Luc MÉLENCHON | 35 | 13,83 | 16,36 |
| M. Nicolas DUPONT-AIGNAN | 17 | 6,72 | 7,94 |
| M. Benoît HAMON | 7 | 2,77 | 3,27 |
| M. Jean LASSALLE | 3 | 1,19 | 1,40 |
| M. François ASSELINEAU | 2 | 0,79 | 0,93 |
| Mme Nathalie ARTHAUD | 1 | 0,40 | 0,47 |
| M. Philippe POUTOU | 0 | 0,00 | 0,00 |
| M. Jacques CHEMINADE | 0 | 0,00 | 0,00 |
Commune de Châtillon-sur-Chalaronne
résultats de la commune au 1er tour
| Liste des candidats | Voix | % Inscrits | % Exprimés |
|---|---|---|---|
| M. François FILLON | 712 | 20,32 | 26,61 |
| Mme Marine LE PEN | 682 | 19,46 | 25,49 |
| M. Emmanuel MACRON | 544 | 15,53 | 20,33 |
| M. Jean-Luc MÉLENCHON | 329 | 9,39 | 12,29 |
| M. Nicolas DUPONT-AIGNAN | 168 | 4,79 | 6,28 |
| M. Benoît HAMON | 129 | 3,68 | 4,82 |
| M. Philippe POUTOU | 36 | 1,03 | 1,35 |
| M. François ASSELINEAU | 28 | 0,80 | 1,05 |
| M. Jean LASSALLE | 22 | 0,63 | 0,82 |
| Mme Nathalie ARTHAUD | 19 | 0,54 | 0,71 |
| M. Jacques CHEMINADE | 7 | 0,20 | 0,26 |
Commune de Crans
résultats de la commune au 1er tour
| Liste des candidats | Voix | % Inscrits | % Exprimés |
|---|---|---|---|
| Mme Marine LE PEN | 63 | 31,19 | 35,20 |
| M. François FILLON | 31 | 15,35 | 17,32 |
| M. Jean-Luc MÉLENCHON | 30 | 14,85 | 16,76 |
| M. Emmanuel MACRON | 28 | 13,86 | 15,64 |
| M. Nicolas DUPONT-AIGNAN | 15 | 7,43 | 8,38 |
| M. Benoît HAMON | 10 | 4,95 | 5,59 |
| Mme Nathalie ARTHAUD | 1 | 0,50 | 0,56 |
| M. François ASSELINEAU | 1 | 0,50 | 0,56 |
| M. Philippe POUTOU | 0 | 0,00 | 0,00 |
| M. Jacques CHEMINADE | 0 | 0,00 | 0,00 |
| M. Jean LASSALLE | 0 | 0,00 | 0,00 |
Commune de Lapeyrouse
résultats de la commune au 1er tour
| Liste des candidats | Voix | % Inscrits | % Exprimés |
|---|---|---|---|
| M. François FILLON | 79 | 31,85 | 35,59 |
| Mme Marine LE PEN | 70 | 28,23 | 31,53 |
| M. Jean-Luc MÉLENCHON | 25 | 10,08 | 11,26 |
| M. Emmanuel MACRON | 24 | 9,68 | 10,81 |
| M. Nicolas DUPONT-AIGNAN | 12 | 4,84 | 5,41 |
| M. François ASSELINEAU | 4 | 1,61 | 1,80 |
| M. Benoît HAMON | 3 | 1,21 | 1,35 |
| M. Jean LASSALLE | 3 | 1,21 | 1,35 |
| Mme Nathalie ARTHAUD | 1 | 0,40 | 0,45 |
| M. Jacques CHEMINADE | 1 | 0,40 | 0,45 |
| M. Philippe POUTOU | 0 | 0,00 | 0,00 |
Commune de Marlieux
résultats de la commune au 1er tour
| Liste des candidats | Voix | % Inscrits | % Exprimés |
|---|---|---|---|
| Mme Marine LE PEN | 181 | 26,97 | 33,39 |
| M. François FILLON | 120 | 17,88 | 22,14 |
| M. Emmanuel MACRON | 102 | 15,20 | 18,82 |
| M. Jean-Luc MÉLENCHON | 56 | 8,35 | 10,33 |
| M. Nicolas DUPONT-AIGNAN | 41 | 6,11 | 7,56 |
| M. Benoît HAMON | 21 | 3,13 | 3,87 |
| M. Philippe POUTOU | 10 | 1,49 | 1,85 |
| M. François ASSELINEAU | 5 | 0,75 | 0,92 |
| Mme Nathalie ARTHAUD | 3 | 0,45 | 0,55 |
| M. Jean LASSALLE | 3 | 0,45 | 0,55 |
| M. Jacques CHEMINADE | 0 | 0,00 | 0,00 |
Commune de Monthieux
résultats de la commune au 1er tour
| Liste des candidats | Voix | % Inscrits | % Exprimés |
|---|---|---|---|
| Mme Marine LE PEN | 108 | 21,77 | 26,34 |
| M. François FILLON | 103 | 20,77 | 25,12 |
| M. Emmanuel MACRON | 93 | 18,75 | 22,68 |
| M. Jean-Luc MÉLENCHON | 54 | 10,89 | 13,17 |
| M. Nicolas DUPONT-AIGNAN | 21 | 4,23 | 5,12 |
| M. Benoît HAMON | 16 | 3,23 | 3,90 |
| M. François ASSELINEAU | 6 | 1,21 | 1,46 |
| M. Jean LASSALLE | 5 | 1,01 | 1,22 |
| Mme Nathalie ARTHAUD | 2 | 0,40 | 0,49 |
| M. Philippe POUTOU | 2 | 0,40 | 0,49 |
| M. Jacques CHEMINADE | 0 | 0,00 | 0,00 |
Commune de Relevant
résultats de la commune au 1er tour
| Liste des candidats | Voix | % Inscrits | % Exprimés |
|---|---|---|---|
| Mme Marine LE PEN | 93 | 27,35 | 31,74 |
| M. François FILLON | 64 | 18,82 | 21,84 |
| M. Emmanuel MACRON | 57 | 16,76 | 19,45 |
| M. Jean-Luc MÉLENCHON | 28 | 8,24 | 9,56 |
| M. Nicolas DUPONT-AIGNAN | 24 | 7,06 | 8,19 |
| M. Benoît HAMON | 14 | 4,12 | 4,78 |
| M. Philippe POUTOU | 3 | 0,88 | 1,02 |
| M. Jean LASSALLE | 3 | 0,88 | 1,02 |
| M. François ASSELINEAU | 3 | 0,88 | 1,02 |
| Mme Nathalie ARTHAUD | 2 | 0,59 | 0,68 |
| M. Jacques CHEMINADE | 2 | 0,59 | 0,68 |
Commune de Saint-André-de-Corcy
résultats de la commune au 1er tour
| Liste des candidats | Voix | % Inscrits | % Exprimés |
|---|---|---|---|
| Mme Marine LE PEN | 553 | 21,98 | 27,16 |
| M. Emmanuel MACRON | 413 | 16,41 | 20,28 |
| M. François FILLON | 386 | 15,34 | 18,96 |
| M. Jean-Luc MÉLENCHON | 358 | 14,23 | 17,58 |
| M. Nicolas DUPONT-AIGNAN | 167 | 6,64 | 8,20 |
| M. Benoît HAMON | 100 | 3,97 | 4,91 |
| M. François ASSELINEAU | 18 | 0,72 | 0,88 |
| M. Jean LASSALLE | 16 | 0,64 | 0,79 |
| M. Philippe POUTOU | 14 | 0,56 | 0,69 |
| Mme Nathalie ARTHAUD | 6 | 0,24 | 0,29 |
| M. Jacques CHEMINADE | 5 | 0,20 | 0,25 |
Commune de Saint-Georges-sur-Renon
résultats de la commune au 1er tour
| Liste des candidats | Voix | % Inscrits | % Exprimés |
|---|---|---|---|
| Mme Marine LE PEN | 33 | 22,15 | 26,40 |
| M. Emmanuel MACRON | 30 | 20,13 | 24,00 |
| M. Jean-Luc MÉLENCHON | 22 | 14,77 | 17,60 |
| M. Nicolas DUPONT-AIGNAN | 14 | 9,40 | 11,20 |
| M. François FILLON | 14 | 9,40 | 11,20 |
| M. Jean LASSALLE | 4 | 2,68 | 3,20 |
| M. Philippe POUTOU | 3 | 2,01 | 2,40 |
| M. Benoît HAMON | 2 | 1,34 | 1,60 |
| Mme Nathalie ARTHAUD | 1 | 0,67 | 0,80 |
| M. Jacques CHEMINADE | 1 | 0,67 | 0,80 |
| M. François ASSELINEAU | 1 | 0,67 | 0,80 |
Commune de Saint-Marcel
résultats de la commune au 1er tour
| Liste des candidats | Voix | % Inscrits | % Exprimés |
|---|---|---|---|
| Mme Marine LE PEN | 251 | 27,98 | 33,47 |
| M. Emmanuel MACRON | 152 | 16,95 | 20,27 |
| M. Jean-Luc MÉLENCHON | 131 | 14,60 | 17,47 |
| M. François FILLON | 116 | 12,93 | 15,47 |
| M. Nicolas DUPONT-AIGNAN | 42 | 4,68 | 5,60 |
| M. Benoît HAMON | 39 | 4,35 | 5,20 |
| M. Philippe POUTOU | 10 | 1,11 | 1,33 |
| Mme Nathalie ARTHAUD | 3 | 0,33 | 0,40 |
| M. François ASSELINEAU | 3 | 0,33 | 0,40 |
| M. Jean LASSALLE | 2 | 0,22 | 0,27 |
| M. Jacques CHEMINADE | 1 | 0,11 | 0,13 |
Commune de Sainte-Olive
résultats de la commune au 1er tour
| Liste des candidats | Voix | % Inscrits | % Exprimés |
|---|---|---|---|
| Mme Marine LE PEN | 71 | 31,98 | 37,57 |
| M. François FILLON | 47 | 21,17 | 24,87 |
| M. Emmanuel MACRON | 40 | 18,02 | 21,16 |
| M. Jean-Luc MÉLENCHON | 13 | 5,86 | 6,88 |
| M. Nicolas DUPONT-AIGNAN | 11 | 4,95 | 5,82 |
| M. Benoît HAMON | 4 | 1,80 | 2,12 |
| M. Jean LASSALLE | 2 | 0,90 | 1,06 |
| M. Philippe POUTOU | 1 | 0,45 | 0,53 |
| Mme Nathalie ARTHAUD | 0 | 0,00 | 0,00 |
| M. Jacques CHEMINADE | 0 | 0,00 | 0,00 |
| M. François ASSELINEAU | 0 | 0,00 | 0,00 |
Commune de Saint-Trivier-sur-Moignans
résultats de la commune au 1er tour
| Liste des candidats | Voix | % Inscrits | % Exprimés |
|---|---|---|---|
| Mme Marine LE PEN | 375 | 28,03 | 35,95 |
| M. François FILLON | 232 | 17,34 | 22,24 |
| M. Emmanuel MACRON | 177 | 13,23 | 16,97 |
| M. Jean-Luc MÉLENCHON | 117 | 8,74 | 11,22 |
| M. Nicolas DUPONT-AIGNAN | 60 | 4,48 | 5,75 |
| M. Benoît HAMON | 51 | 3,81 | 4,89 |
| M. Jean LASSALLE | 9 | 0,67 | 0,86 |
| M. François ASSELINEAU | 8 | 0,60 | 0,77 |
| Mme Nathalie ARTHAUD | 7 | 0,52 | 0,67 |
| M. Philippe POUTOU | 6 | 0,45 | 0,58 |
| M. Jacques CHEMINADE | 1 | 0,07 | 0,10 |
Commune de Sulignat
résultats de la commune au 1er tour
| Liste des candidats | Voix | % Inscrits | % Exprimés |
|---|---|---|---|
| Mme Marine LE PEN | 123 | 28,87 | 35,34 |
| M. François FILLON | 72 | 16,90 | 20,69 |
| M. Emmanuel MACRON | 60 | 14,08 | 17,24 |
| M. Jean-Luc MÉLENCHON | 41 | 9,62 | 11,78 |
| M. Nicolas DUPONT-AIGNAN | 25 | 5,87 | 7,18 |
| M. Benoît HAMON | 17 | 3,99 | 4,89 |
| M. Jean LASSALLE | 6 | 1,41 | 1,72 |
| M. Philippe POUTOU | 2 | 0,47 | 0,57 |
| M. Jacques CHEMINADE | 1 | 0,23 | 0,29 |
| M. François ASSELINEAU | 1 | 0,23 | 0,29 |
| Mme Nathalie ARTHAUD | 0 | 0,00 | 0,00 |
Commune de Villars-les-Dombes
résultats de la commune au 1er tour
| Liste des candidats | Voix | % Inscrits | % Exprimés |
|---|---|---|---|
| Mme Marine LE PEN | 708 | 21,89 | 27,31 |
| M. Emmanuel MACRON | 577 | 17,84 | 22,26 |
| M. François FILLON | 555 | 17,16 | 21,41 |
| M. Jean-Luc MÉLENCHON | 396 | 12,24 | 15,28 |
| M. Nicolas DUPONT-AIGNAN | 150 | 4,64 | 5,79 |
| M. Benoît HAMON | 125 | 3,87 | 4,82 |
| M. Philippe POUTOU | 22 | 0,68 | 0,85 |
| M. Jean LASSALLE | 22 | 0,68 | 0,85 |
| Mme Nathalie ARTHAUD | 19 | 0,59 | 0,73 |
| M. François ASSELINEAU | 13 | 0,40 | 0,50 |
| M. Jacques CHEMINADE | 5 | 0,15 | 0,19 |
Commune de Ambérieux-en-Dombes
résultats de la commune au 1er tour
| Liste des candidats | Voix | % Inscrits | % Exprimés |
|---|---|---|---|
| Mme Marine LE PEN | 306 | 26,11 | 32,80 |
| M. François FILLON | 197 | 16,81 | 21,11 |
| M. Emmanuel MACRON | 191 | 16,30 | 20,47 |
| M. Jean-Luc MÉLENCHON | 126 | 10,75 | 13,50 |
| M. Nicolas DUPONT-AIGNAN | 45 | 3,84 | 4,82 |
| M. Benoît HAMON | 37 | 3,16 | 3,97 |
| M. Philippe POUTOU | 10 | 0,85 | 1,07 |
| M. François ASSELINEAU | 10 | 0,85 | 1,07 |
| M. Jean LASSALLE | 6 | 0,51 | 0,64 |
| Mme Nathalie ARTHAUD | 5 | 0,43 | 0,54 |
| M. Jacques CHEMINADE | 0 | 0,00 | 0,00 |
Commune de Birieux
résultats de la commune au 1er tour
| Liste des candidats | Voix | % Inscrits | % Exprimés |
|---|---|---|---|
| Mme Marine LE PEN | 62 | 32,29 | 39,24 |
| M. François FILLON | 37 | 19,27 | 23,42 |
| M. Emmanuel MACRON | 32 | 16,67 | 20,25 |
| M. Jean-Luc MÉLENCHON | 9 | 4,69 | 5,70 |
| M. Nicolas DUPONT-AIGNAN | 8 | 4,17 | 5,06 |
| M. Benoît HAMON | 4 | 2,08 | 2,53 |
| M. Jean LASSALLE | 4 | 2,08 | 2,53 |
| M. Philippe POUTOU | 2 | 1,04 | 1,27 |
| Mme Nathalie ARTHAUD | 0 | 0,00 | 0,00 |
| M. Jacques CHEMINADE | 0 | 0,00 | 0,00 |
| M. François ASSELINEAU | 0 | 0,00 | 0,00 |
Commune de Chalamont
résultats de la commune au 1er tour
| Liste des candidats | Voix | % Inscrits | % Exprimés |
|---|---|---|---|
| Mme Marine LE PEN | 401 | 25,99 | 33,36 |
| M. François FILLON | 238 | 15,42 | 19,80 |
| M. Emmanuel MACRON | 209 | 13,55 | 17,39 |
| M. Jean-Luc MÉLENCHON | 165 | 10,69 | 13,73 |
| M. Nicolas DUPONT-AIGNAN | 84 | 5,44 | 6,99 |
| M. Benoît HAMON | 67 | 4,34 | 5,57 |
| M. François ASSELINEAU | 16 | 1,04 | 1,33 |
| M. Jean LASSALLE | 10 | 0,65 | 0,83 |
| Mme Nathalie ARTHAUD | 6 | 0,39 | 0,50 |
| M. Philippe POUTOU | 5 | 0,32 | 0,42 |
| M. Jacques CHEMINADE | 1 | 0,06 | 0,08 |
Commune de La Chapelle-du-Châtelard
résultats de la commune au 1er tour
| Liste des candidats | Voix | % Inscrits | % Exprimés |
|---|---|---|---|
| Mme Marine LE PEN | 77 | 26,46 | 31,95 |
| M. François FILLON | 50 | 17,18 | 20,75 |
| M. Emmanuel MACRON | 41 | 14,09 | 17,01 |
| M. Nicolas DUPONT-AIGNAN | 30 | 10,31 | 12,45 |
| M. Jean-Luc MÉLENCHON | 19 | 6,53 | 7,88 |
| M. Benoît HAMON | 13 | 4,47 | 5,39 |
| M. François ASSELINEAU | 7 | 2,41 | 2,90 |
| M. Philippe POUTOU | 2 | 0,69 | 0,83 |
| Mme Nathalie ARTHAUD | 1 | 0,34 | 0,41 |
| M. Jean LASSALLE | 1 | 0,34 | 0,41 |
| M. Jacques CHEMINADE | 0 | 0,00 | 0,00 |
Commune de Châtillon-la-Palud
résultats de la commune au 1er tour
| Liste des candidats | Voix | % Inscrits | % Exprimés |
|---|---|---|---|
| Mme Marine LE PEN | 331 | 27,56 | 34,02 |
| M. Emmanuel MACRON | 188 | 15,65 | 19,32 |
| M. François FILLON | 169 | 14,07 | 17,37 |
| M. Jean-Luc MÉLENCHON | 147 | 12,24 | 15,11 |
| M. Benoît HAMON | 52 | 4,33 | 5,34 |
| M. Nicolas DUPONT-AIGNAN | 50 | 4,16 | 5,14 |
| M. François ASSELINEAU | 11 | 0,92 | 1,13 |
| M. Philippe POUTOU | 10 | 0,83 | 1,03 |
| Mme Nathalie ARTHAUD | 9 | 0,75 | 0,92 |
| M. Jean LASSALLE | 6 | 0,50 | 0,62 |
| M. Jacques CHEMINADE | 0 | 0,00 | 0,00 |
Commune de Condeissiat
résultats de la commune au 1er tour
| Liste des candidats | Voix | % Inscrits | % Exprimés |
|---|---|---|---|
| Mme Marine LE PEN | 123 | 21,03 | 25,52 |
| M. Emmanuel MACRON | 122 | 20,85 | 25,31 |
| M. François FILLON | 96 | 16,41 | 19,92 |
| M. Jean-Luc MÉLENCHON | 57 | 9,74 | 11,83 |
| M. Nicolas DUPONT-AIGNAN | 39 | 6,67 | 8,09 |
| M. Benoît HAMON | 22 | 3,76 | 4,56 |
| M. Jean LASSALLE | 9 | 1,54 | 1,87 |
| M. Philippe POUTOU | 5 | 0,85 | 1,04 |
| Mme Nathalie ARTHAUD | 4 | 0,68 | 0,83 |
| M. François ASSELINEAU | 4 | 0,68 | 0,83 |
| M. Jacques CHEMINADE | 1 | 0,17 | 0,21 |
Commune de Dompierre-sur-Chalaronne
résultats de la commune au 1er tour
| Liste des candidats | Voix | % Inscrits | % Exprimés |
|---|---|---|---|
| Mme Marine LE PEN | 58 | 20,42 | 25,66 |
| M. Emmanuel MACRON | 56 | 19,72 | 24,78 |
| M. François FILLON | 53 | 18,66 | 23,45 |
| M. Jean-Luc MÉLENCHON | 27 | 9,51 | 11,95 |
| M. Nicolas DUPONT-AIGNAN | 14 | 4,93 | 6,19 |
| M. Benoît HAMON | 13 | 4,58 | 5,75 |
| M. François ASSELINEAU | 3 | 1,06 | 1,33 |
| M. Philippe POUTOU | 1 | 0,35 | 0,44 |
| M. Jean LASSALLE | 1 | 0,35 | 0,44 |
| Mme Nathalie ARTHAUD | 0 | 0,00 | 0,00 |
| M. Jacques CHEMINADE | 0 | 0,00 | 0,00 |
Commune de Le Plantay
résultats de la commune au 1er tour
| Liste des candidats | Voix | % Inscrits | % Exprimés |
|---|---|---|---|
| Mme Marine LE PEN | 115 | 29,41 | 34,85 |
| M. François FILLON | 107 | 27,37 | 32,42 |
| M. Emmanuel MACRON | 43 | 11,00 | 13,03 |
| M. Jean-Luc MÉLENCHON | 31 | 7,93 | 9,39 |
| M. Nicolas DUPONT-AIGNAN | 15 | 3,84 | 4,55 |
| M. Benoît HAMON | 7 | 1,79 | 2,12 |
| M. Jean LASSALLE | 5 | 1,28 | 1,52 |
| Mme Nathalie ARTHAUD | 3 | 0,77 | 0,91 |
| M. Philippe POUTOU | 3 | 0,77 | 0,91 |
| M. François ASSELINEAU | 1 | 0,26 | 0,30 |
| M. Jacques CHEMINADE | 0 | 0,00 | 0,00 |
Commune de Mionnay
résultats de la commune au 1er tour
| Liste des candidats | Voix | % Inscrits | % Exprimés |
|---|---|---|---|
| M. François FILLON | 346 | 19,97 | 25,24 |
| Mme Marine LE PEN | 345 | 19,91 | 25,16 |
| M. Emmanuel MACRON | 324 | 18,70 | 23,63 |
| M. Jean-Luc MÉLENCHON | 197 | 11,37 | 14,37 |
| M. Nicolas DUPONT-AIGNAN | 73 | 4,21 | 5,32 |
| M. Benoît HAMON | 48 | 2,77 | 3,50 |
| M. Philippe POUTOU | 10 | 0,58 | 0,73 |
| M. Jean LASSALLE | 10 | 0,58 | 0,73 |
| M. François ASSELINEAU | 9 | 0,52 | 0,66 |
| Mme Nathalie ARTHAUD | 8 | 0,46 | 0,58 |
| M. Jacques CHEMINADE | 1 | 0,06 | 0,07 |
Commune de Neuville-les-Dames
résultats de la commune au 1er tour
| Liste des candidats | Voix | % Inscrits | % Exprimés |
|---|---|---|---|
| Mme Marine LE PEN | 269 | 26,09 | 31,65 |
| M. François FILLON | 186 | 18,04 | 21,88 |
| M. Emmanuel MACRON | 168 | 16,29 | 19,76 |
| M. Jean-Luc MÉLENCHON | 89 | 8,63 | 10,47 |
| M. Nicolas DUPONT-AIGNAN | 70 | 6,79 | 8,24 |
| M. Benoît HAMON | 37 | 3,59 | 4,35 |
| M. Philippe POUTOU | 12 | 1,16 | 1,41 |
| M. Jean LASSALLE | 9 | 0,87 | 1,06 |
| Mme Nathalie ARTHAUD | 6 | 0,58 | 0,71 |
| M. François ASSELINEAU | 3 | 0,29 | 0,35 |
| M. Jacques CHEMINADE | 1 | 0,10 | 0,12 |
Commune de Romans
résultats de la commune au 1er tour
| Liste des candidats | Voix | % Inscrits | % Exprimés |
|---|---|---|---|
| Mme Marine LE PEN | 100 | 26,46 | 32,79 |
| M. Emmanuel MACRON | 65 | 17,20 | 21,31 |
| M. François FILLON | 63 | 16,67 | 20,66 |
| M. Jean-Luc MÉLENCHON | 31 | 8,20 | 10,16 |
| M. Nicolas DUPONT-AIGNAN | 24 | 6,35 | 7,87 |
| M. Benoît HAMON | 12 | 3,17 | 3,93 |
| M. Jean LASSALLE | 5 | 1,32 | 1,64 |
| M. Jacques CHEMINADE | 2 | 0,53 | 0,66 |
| Mme Nathalie ARTHAUD | 1 | 0,26 | 0,33 |
| M. Philippe POUTOU | 1 | 0,26 | 0,33 |
| M. François ASSELINEAU | 1 | 0,26 | 0,33 |
Commune de Saint-André-le-Bouchoux
résultats de la commune au 1er tour
| Liste des candidats | Voix | % Inscrits | % Exprimés |
|---|---|---|---|
| Mme Marine LE PEN | 66 | 27,27 | 32,04 |
| M. Emmanuel MACRON | 45 | 18,60 | 21,84 |
| M. François FILLON | 39 | 16,12 | 18,93 |
| M. Jean-Luc MÉLENCHON | 22 | 9,09 | 10,68 |
| M. Nicolas DUPONT-AIGNAN | 20 | 8,26 | 9,71 |
| M. Jean LASSALLE | 6 | 2,48 | 2,91 |
| M. Benoît HAMON | 5 | 2,07 | 2,43 |
| M. Jacques CHEMINADE | 2 | 0,83 | 0,97 |
| M. Philippe POUTOU | 1 | 0,41 | 0,49 |
| Mme Nathalie ARTHAUD | 0 | 0,00 | 0,00 |
| M. François ASSELINEAU | 0 | 0,00 | 0,00 |
Commune de Saint-Germain-sur-Renon
résultats de la commune au 1er tour
| Liste des candidats | Voix | % Inscrits | % Exprimés |
|---|---|---|---|
| Mme Marine LE PEN | 61 | 30,05 | 39,35 |
| M. François FILLON | 45 | 22,17 | 29,03 |
| M. Emmanuel MACRON | 24 | 11,82 | 15,48 |
| M. Nicolas DUPONT-AIGNAN | 13 | 6,40 | 8,39 |
| M. Jean-Luc MÉLENCHON | 9 | 4,43 | 5,81 |
| Mme Nathalie ARTHAUD | 1 | 0,49 | 0,65 |
| M. Philippe POUTOU | 1 | 0,49 | 0,65 |
| M. Jean LASSALLE | 1 | 0,49 | 0,65 |
| M. Benoît HAMON | 0 | 0,00 | 0,00 |
| M. Jacques CHEMINADE | 0 | 0,00 | 0,00 |
| M. François ASSELINEAU | 0 | 0,00 | 0,00 |
Commune de Saint-Nizier-le-Désert
résultats de la commune au 1er tour
| Liste des candidats | Voix | % Inscrits | % Exprimés |
|---|---|---|---|
| Mme Marine LE PEN | 180 | 29,08 | 36,44 |
| M. François FILLON | 88 | 14,22 | 17,81 |
| M. Jean-Luc MÉLENCHON | 80 | 12,92 | 16,19 |
| M. Emmanuel MACRON | 77 | 12,44 | 15,59 |
| M. Nicolas DUPONT-AIGNAN | 30 | 4,85 | 6,07 |
| M. Benoît HAMON | 24 | 3,88 | 4,86 |
| M. Jean LASSALLE | 6 | 0,97 | 1,21 |
| Mme Nathalie ARTHAUD | 3 | 0,48 | 0,61 |
| M. Philippe POUTOU | 3 | 0,48 | 0,61 |
| M. François ASSELINEAU | 2 | 0,32 | 0,40 |
| M. Jacques CHEMINADE | 1 | 0,16 | 0,20 |
Commune de Saint-Paul-de-Varax
résultats de la commune au 1er tour
| Liste des candidats | Voix | % Inscrits | % Exprimés |
|---|---|---|---|
| Mme Marine LE PEN | 315 | 30,00 | 38,00 |
| M. François FILLON | 159 | 15,14 | 19,18 |
| M. Emmanuel MACRON | 145 | 13,81 | 17,49 |
| M. Jean-Luc MÉLENCHON | 105 | 10,00 | 12,67 |
| M. Nicolas DUPONT-AIGNAN | 50 | 4,76 | 6,03 |
| M. Benoît HAMON | 31 | 2,95 | 3,74 |
| M. Philippe POUTOU | 11 | 1,05 | 1,33 |
| M. Jean LASSALLE | 6 | 0,57 | 0,72 |
| Mme Nathalie ARTHAUD | 3 | 0,29 | 0,36 |
| M. François ASSELINEAU | 3 | 0,29 | 0,36 |
| M. Jacques CHEMINADE | 1 | 0,10 | 0,12 |
Commune de Sandrans
résultats de la commune au 1er tour
| Liste des candidats | Voix | % Inscrits | % Exprimés |
|---|---|---|---|
| Mme Marine LE PEN | 111 | 29,21 | 34,26 |
| M. François FILLON | 87 | 22,89 | 26,85 |
| M. Emmanuel MACRON | 54 | 14,21 | 16,67 |
| M. Nicolas DUPONT-AIGNAN | 26 | 6,84 | 8,02 |
| M. Jean-Luc MÉLENCHON | 22 | 5,79 | 6,79 |
| M. Benoît HAMON | 11 | 2,89 | 3,40 |
| M. Philippe POUTOU | 5 | 1,32 | 1,54 |
| M. Jean LASSALLE | 4 | 1,05 | 1,23 |
| M. François ASSELINEAU | 3 | 0,79 | 0,93 |
| Mme Nathalie ARTHAUD | 1 | 0,26 | 0,31 |
| M. Jacques CHEMINADE | 0 | 0,00 | 0,00 |
Commune de Valeins
résultats de la commune au 1er tour
| Liste des candidats | Voix | % Inscrits | % Exprimés |
|---|---|---|---|
| M. François FILLON | 28 | 30,43 | 37,33 |
| Mme Marine LE PEN | 16 | 17,39 | 21,33 |
| M. Nicolas DUPONT-AIGNAN | 13 | 14,13 | 17,33 |
| M. Emmanuel MACRON | 10 | 10,87 | 13,33 |
| M. Jean-Luc MÉLENCHON | 6 | 6,52 | 8,00 |
| M. Benoît HAMON | 1 | 1,09 | 1,33 |
| M. Jean LASSALLE | 1 | 1,09 | 1,33 |
| Mme Nathalie ARTHAUD | 0 | 0,00 | 0,00 |
| M. Philippe POUTOU | 0 | 0,00 | 0,00 |
| M. Jacques CHEMINADE | 0 | 0,00 | 0,00 |
| M. François ASSELINEAU | 0 | 0,00 | 0,00 |
Commune de Villette-sur-Ain
résultats de la commune au 1er tour
| Liste des candidats | Voix | % Inscrits | % Exprimés |
|---|---|---|---|
| Mme Marine LE PEN | 137 | 23,54 | 28,19 |
| M. Emmanuel MACRON | 102 | 17,53 | 20,99 |
| M. François FILLON | 87 | 14,95 | 17,90 |
| M. Jean-Luc MÉLENCHON | 75 | 12,89 | 15,43 |
| M. Nicolas DUPONT-AIGNAN | 36 | 6,19 | 7,41 |
| M. Benoît HAMON | 23 | 3,95 | 4,73 |
| M. François ASSELINEAU | 10 | 1,72 | 2,06 |
| M. Philippe POUTOU | 7 | 1,20 | 1,44 |
| M. Jean LASSALLE | 6 | 1,03 | 1,23 |
| M. Jacques CHEMINADE | 2 | 0,34 | 0,41 |
| Mme Nathalie ARTHAUD | 1 | 0,17 | 0,21 |
Taux de participation
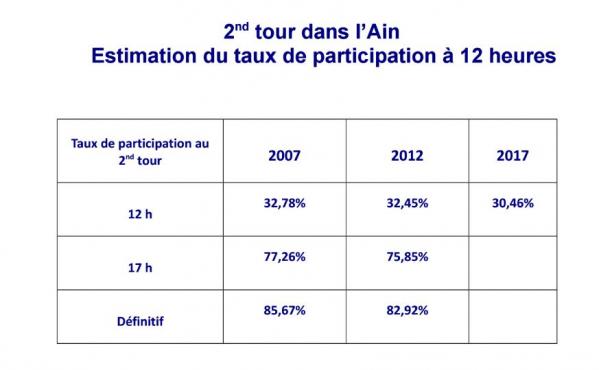
Taux de participation à 12h00 :
Dans le département de l'Ain, le taux de participation estimé à 12h est de 33,27% A la même heure, en 2012 il était de 29,87% et en 2007 de 31,82%.
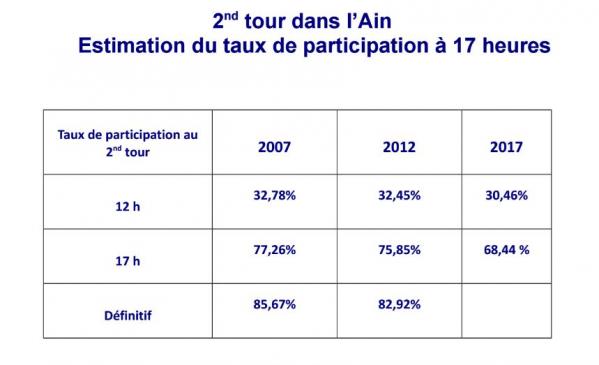
Taux de participation à 17h00 :
Dans le département de l'Ain, le taux de participation estimé à 17h est de 70,32% A la même heure, en 2012 il était de 76,54% et en 2007 de 73,33%
Quelques chiffres
47 millions de votants soit +2% par rapport à 2012.
Il y a 5 ans. 1er tour en 2012 pour le département :
Résultats* 1er tour
| Nombre | % Inscrits | % Votants | |
| Inscrits | 393 808 | ||
| Abstentions | 65 996 | 16,76 | |
| Votants | 327 812 | 83,24 | |
| Blancs ou nuls | 6 453 | 1,64 | 1,97 |
| Exprimés | 321 359 | 81,60 | 98,03 |
| Liste des candidats | Voix | % Exprimés |
| Mme Eva JOLY | 7 268 | 2,26 |
| Mme Marine LE PEN | 66 540 | 20,71 |
| M. Nicolas SARKOZY | 97 722 | 30,41 |
| M. Jean-Luc MÉLENCHON | 30 898 | 9,61 |
| M. Philippe POUTOU | 3 323 | 1,03 |
| Mme Nathalie ARTHAUD | 1 794 | 0,56 |
| M. Jacques CHEMINADE | 860 | 0,27 |
| M. François BAYROU | 32 650 | 10,16 |
| M. Nicolas DUPONT-AIGNAN | 7 208 | 2,24 |
| M. François HOLLANDE | 73 096 | 22,75 |
En raison des arrondis à la deuxième décimale, la somme des %Exprimés peut ne pas être égale à 100,00% .
Résultat élection présidentielle 2017
Date de dernière mise à jour : 08/05/2017